Aria Operations | Aria Appliances Observability

How to monitor VMware Aria Appliances within your environment
“I believe that if you show people the problems and you show them the solutions, they will be moved to act.” - Bill Gates
Aria Appliance Observability
In my previous blog, I discussed VMware vCenter appliance observability. Click here to read the blog. Building on those ideas, I now want to demonstrate how to monitor VMware Aria Appliances. Monitoring and observing VMware Aria Appliance VMs is crucial in a VMware environment where many such appliances are present.
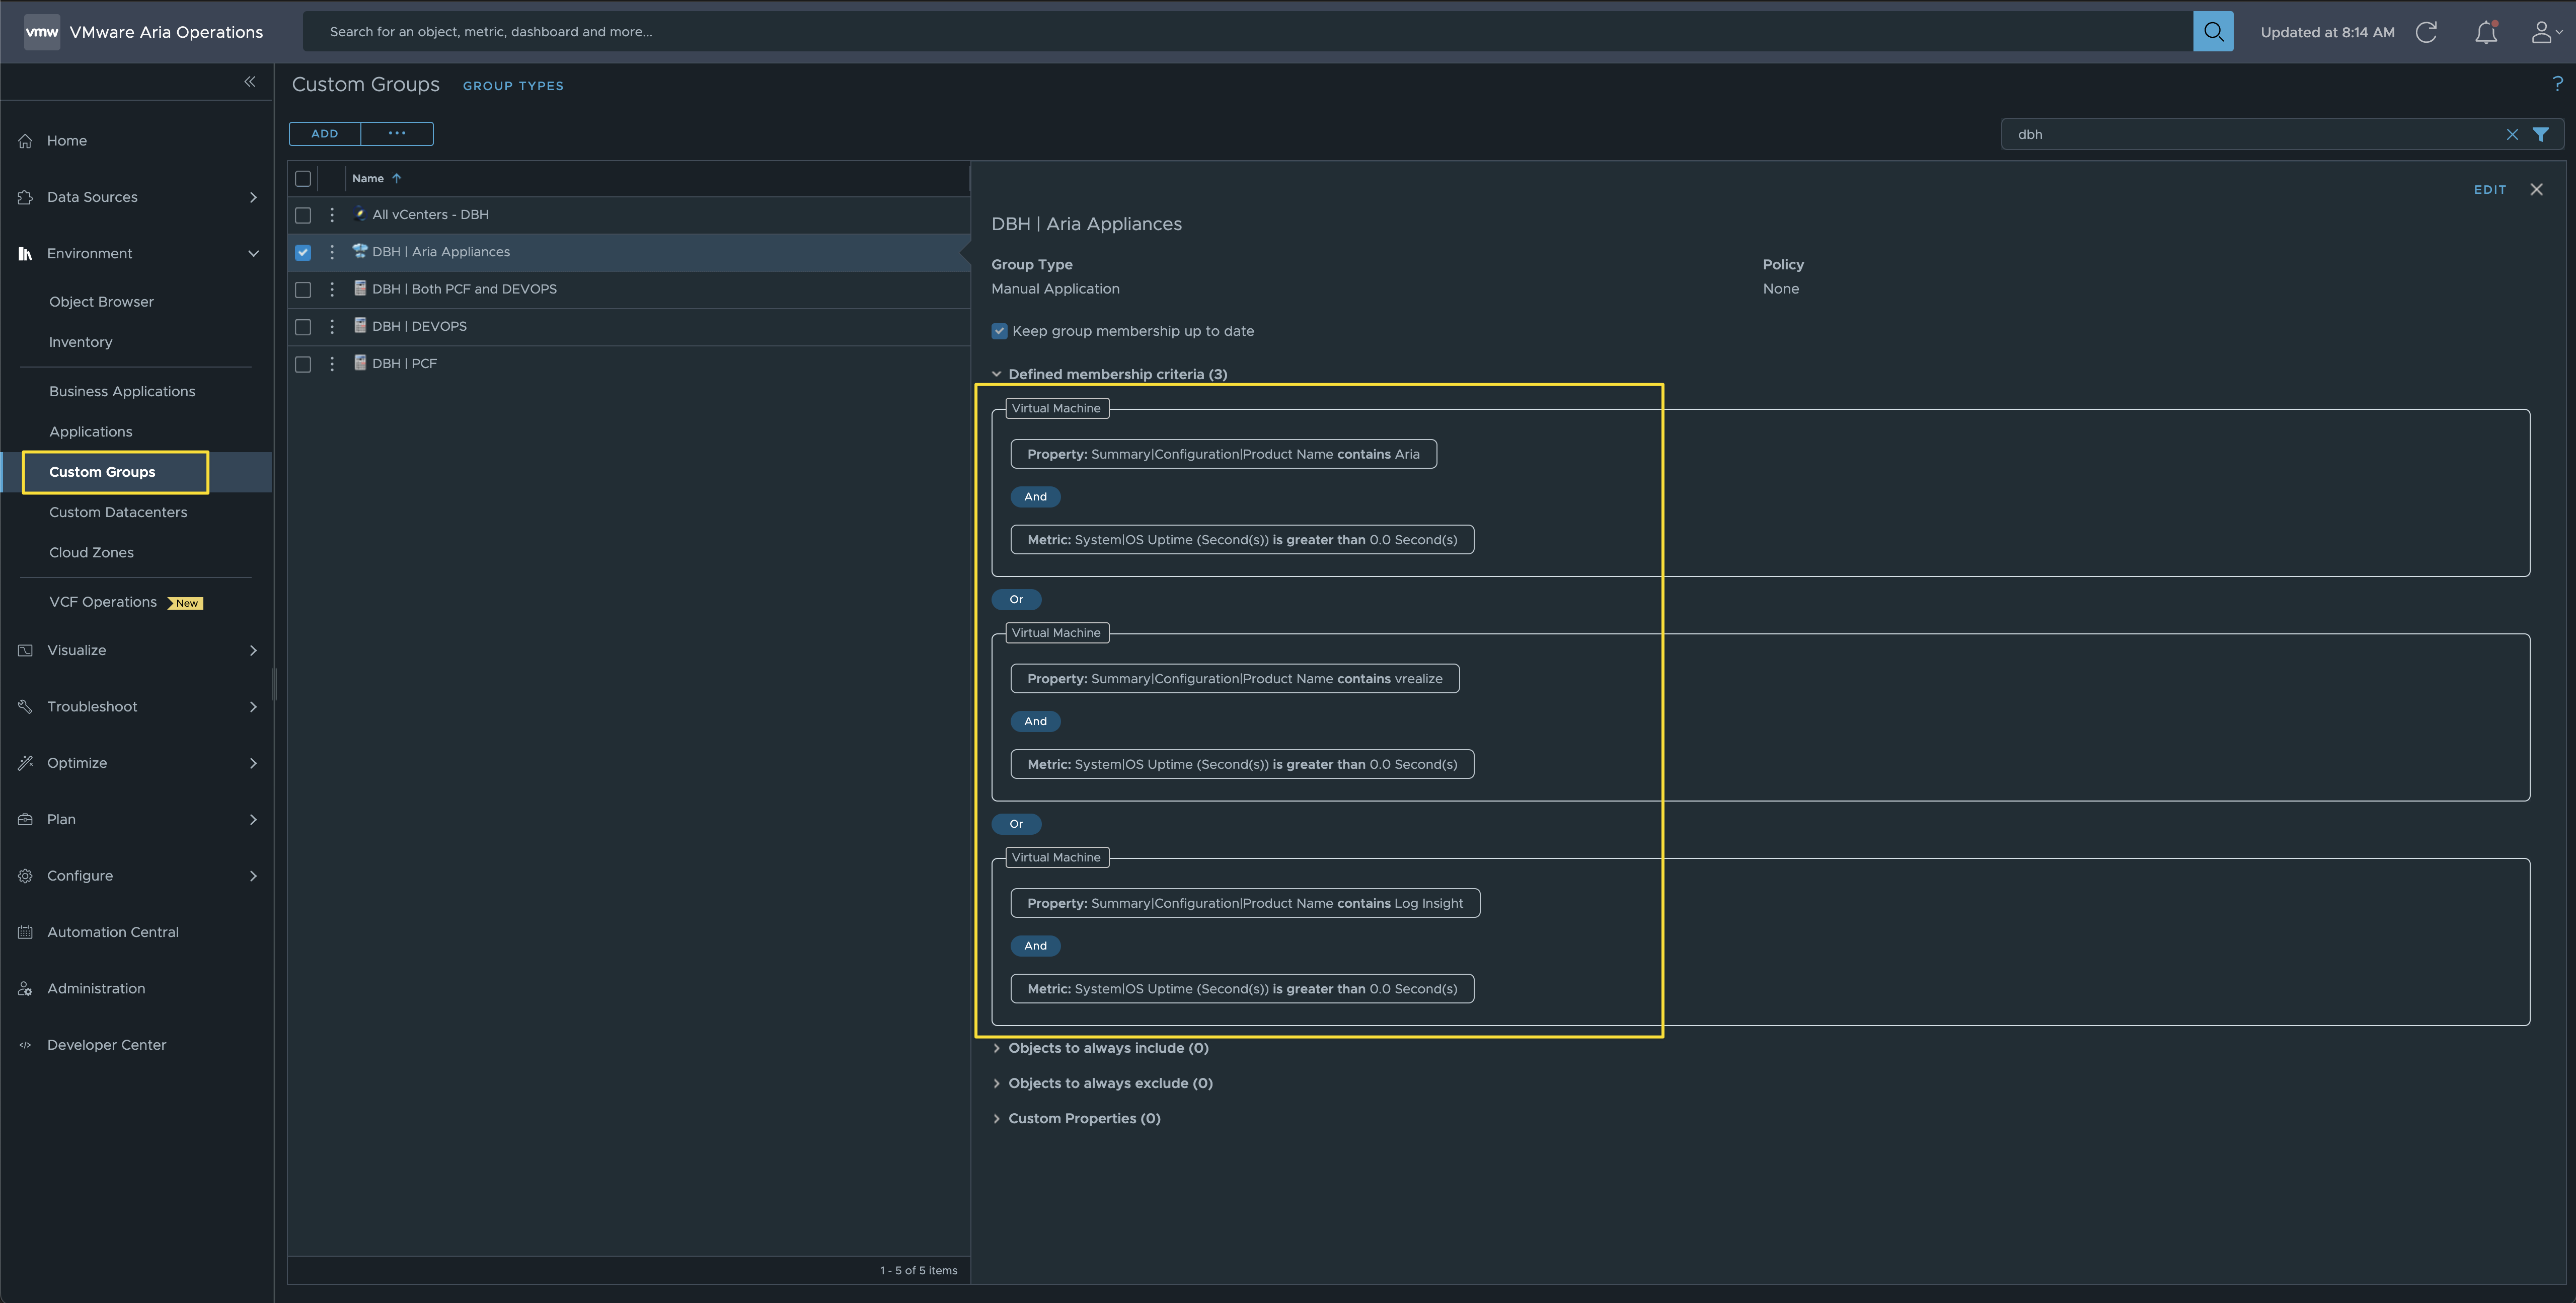
For VMware Aria Appliances, I created a Custom Group within VMware Aria Operations. These appliances have a property named “Summary|Configuration|Product Name”. By using a filter that checks if the Product Name contains “Aria”, “vRealize”, or “Log Insight”, I was able to group all VMware Aria Appliance VMs together. See Screen Shot below.
This filter is applicable to the following Aria Appliances:
- Aria Operations
- Aria Operations for Logs
- Aria Automation
- Aria Suite LifeCycle
- Aria Cloud Proxies
- Aria Operations for Networks
- Aria Management Pack Builder
- vCenter Orchestrator
After creating the Custom Group to select only VMware Aria Appliance VMs, I proceeded to build a comprehensive VMware Aria Appliance Monitoring Dashboard. At the top, I included some donut charts (my favorite) to display key metrics such as VMware Aria Appliances Health, Workload, Snapshots, and Uptime in days.
I have a strong preference against VMs running on snapshots for extended periods, which is why I included a chart for Snapshots. Uptime is also a crucial metric, as it provides insight into a VMs maintenance status. When I see a VM running for hundreds of days, my first thought is that it hasn’t been patched or upgraded in a while. To ensure the best reliability and access to the latest features, it’s important to keep Aria Appliances patched and upgraded regularly.
Steps to Create the Dashboard
- Create the (5) Views
- Show all Aria Appliance VMs with details
- Show VM Health
- Show VM Workload
- Show Snapshot Status
- Show Uptime (Days)
- Create the Dashboard
To simplify getting started, all the Views and the Dashboard are available in my GitHub repository for download. Click Here to Download the files.
Custom Group Filter to Select Aria Appliance VMs
Filter Definition:
Dashboard Screen Shot:
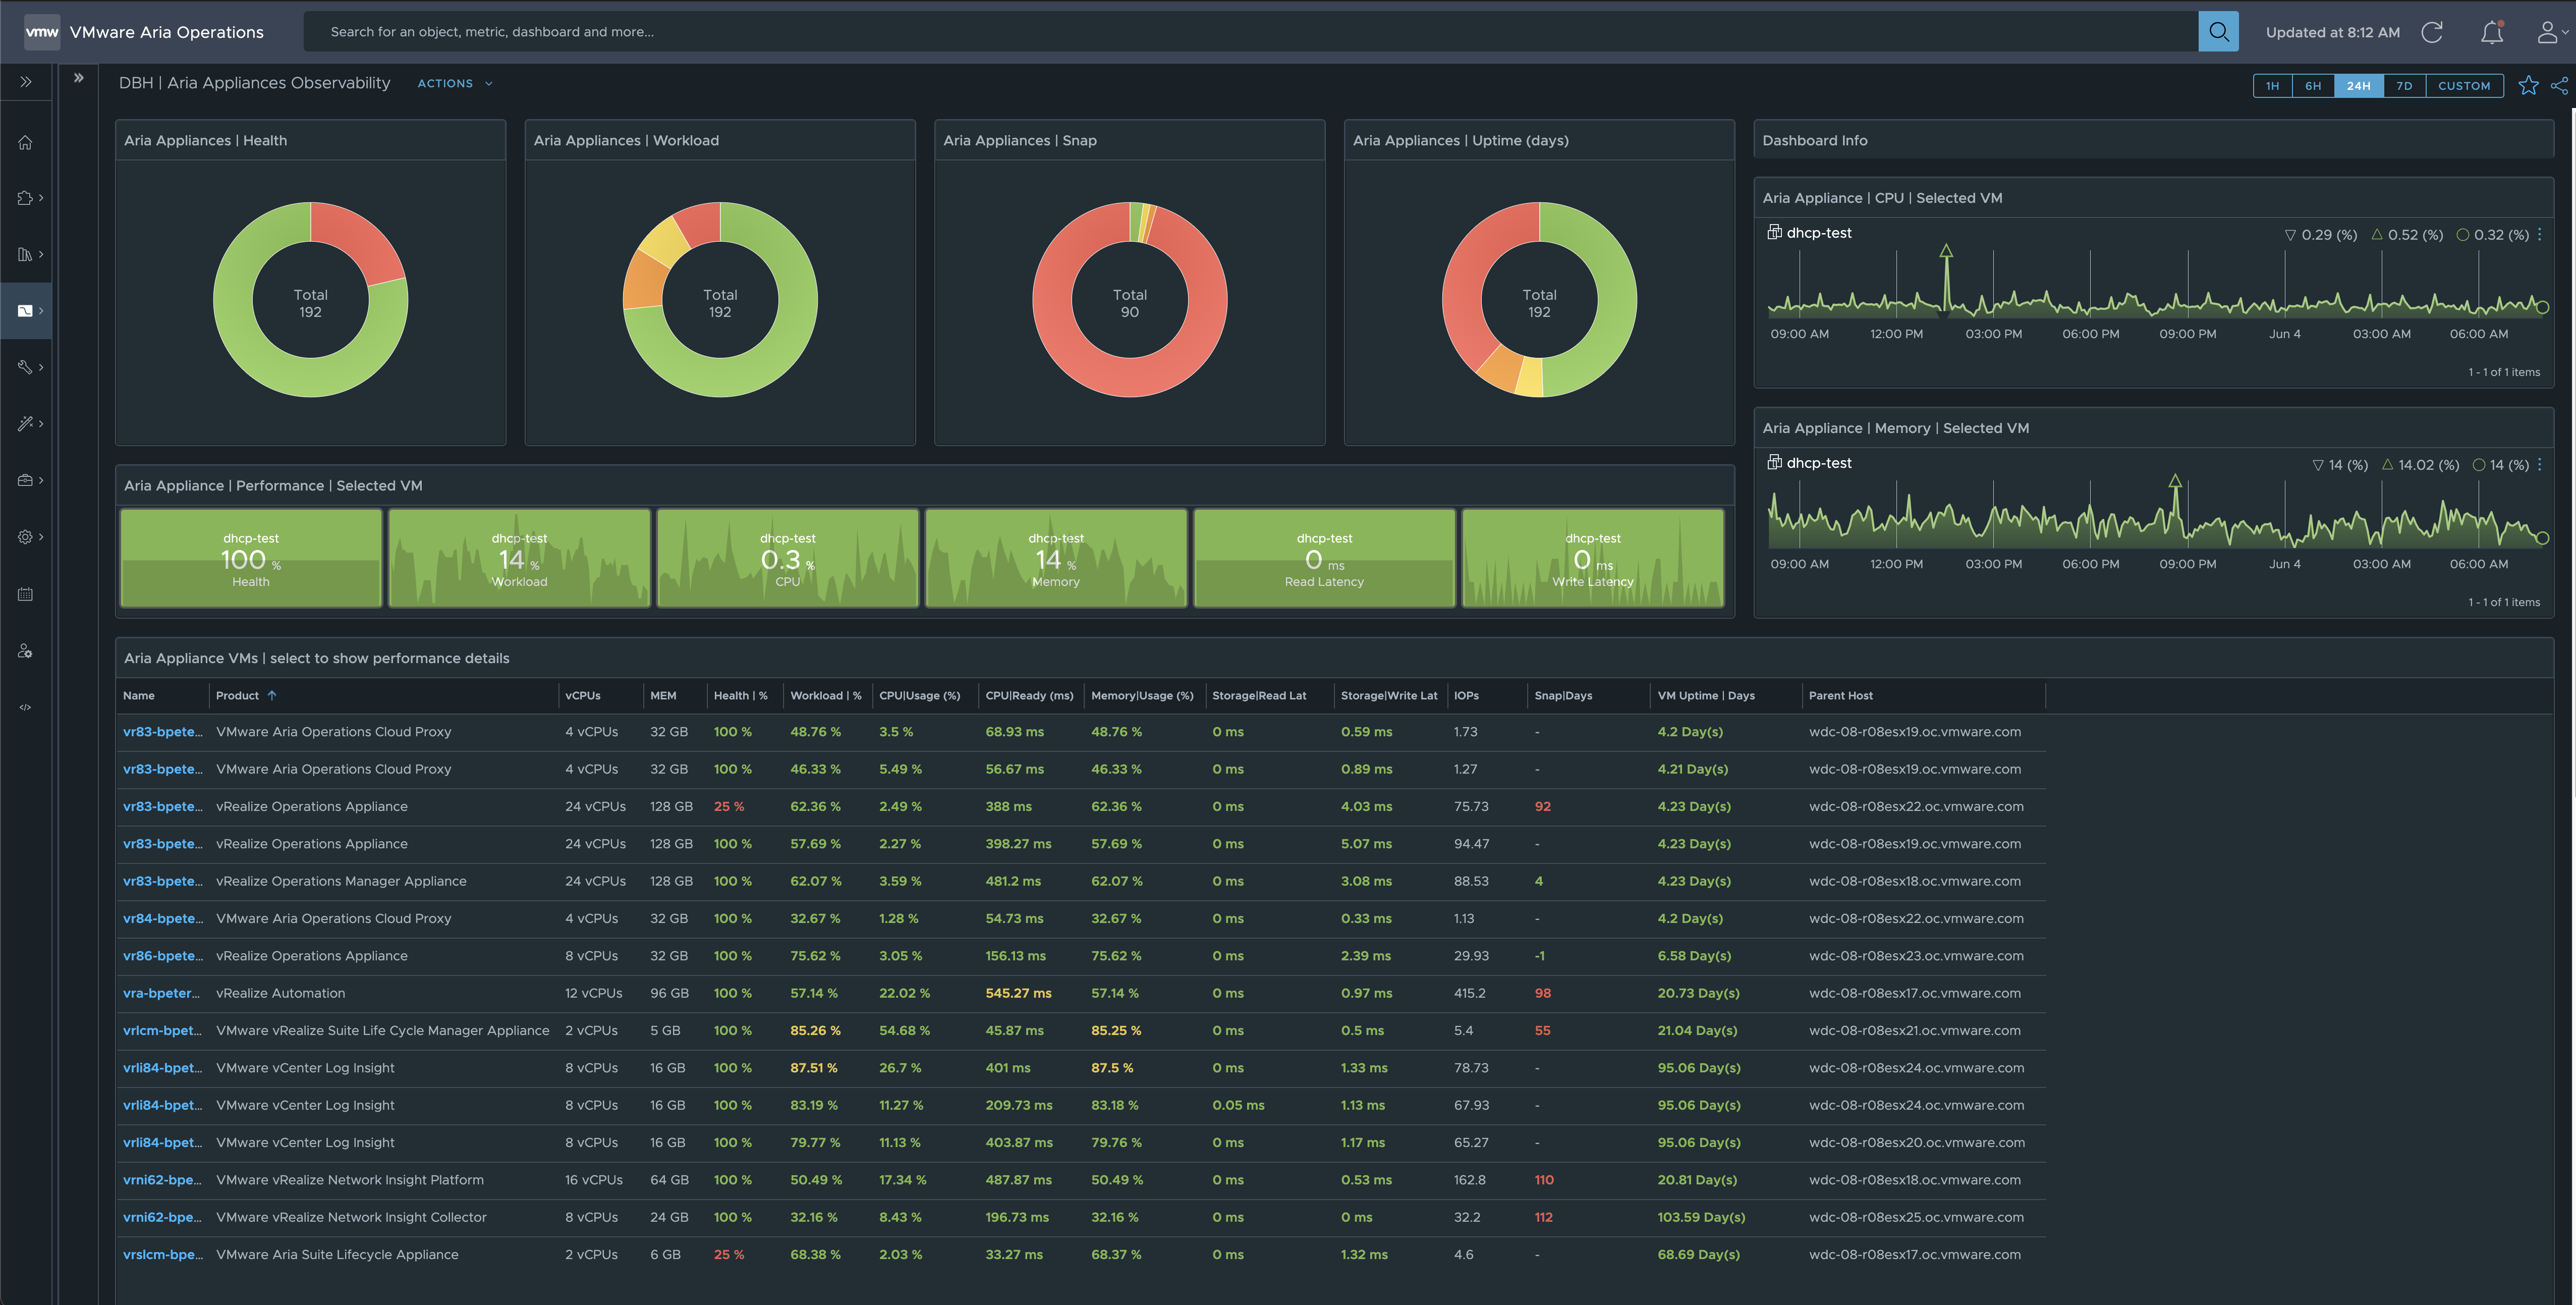
Dashboard Usage:
Links to resources discussed is this Blog Post:
Product Version used for Blog Post:
- Aria Operations: 8.17.1
Lessons Learned:
- I can use the Virtual Machine property named “Summary|Configuration|Product Name” to group all VMware Aria Appliances together. The filter within the Custom Group is what enables this Dashboard to work.
- If you found this blog article helpful and it assisted you, consider buying me a coffee to kickstart my day.